<FOOLISH FOUR PORTFOLIO>
Too Popular, Two
A more scientific look at the controversy
by Chris Rugaber (TMF [email protected])
Alexandria, VA (May 27, 1999) -- Today I want to look at one last aspect of the "popularity" question that I examined last week. We have looked at this extensively, but bear with me because this is interesting, and because we Fools want to be our own best critics.
The general issue we're examining is whether, as a result of the large numbers of investors following the strategy, the Foolish Four will no longer produce the same returns as it once did.
Last week we looked at the trading volumes and share prices of the Foolish Four stocks in the week before the first trading day of the year and in a three-month period from October 15th to January 15th in the 1997-98 and 1998-99 time frames. It was clear that while there were some jumps upward in price and trading volume as we got closer to the first trading day of January, it wasn't outside the normal range of market ups-and-downs. In fact, it could be argued that the end-of-year increase in trading of the Foolish Four stocks simply represented a return to normal trading levels after the holiday period.
However, after we posted the article, one of our readers and regular contributors to the message boards, William Lipp, proposed that I look at the lower-yield, non-Foolish four stocks. What did they look like from mid-October to mid-January?
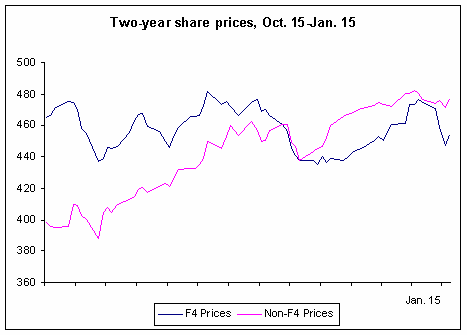
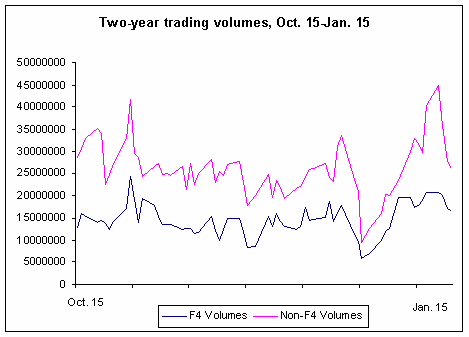
The answer to that question proved interesting. As I did last week with the Foolish Four, I combined the share prices and trading volumes for four of the lowest-yielding stocks in the Dow in the last two years. Those stocks were Disney <% if gsSubBrand = "aolsnapshot" then Response.Write("(NYSE: DIS)") else Response.Write("(NYSE: DIS)") end if %>, IBM <% if gsSubBrand = "aolsnapshot" then Response.Write("(NYSE: IBM)") else Response.Write("(NYSE: IBM)") end if %>, McDonald's <% if gsSubBrand = "aolsnapshot" then Response.Write("(NYSE: MCD)") else Response.Write("(NYSE: MCD)") end if %>, and Wal-Mart <% if gsSubBrand = "aolsnapshot" then Response.Write("(NYSE: WMT)") else Response.Write("(NYSE: WMT)") end if %>. I added together their daily closing prices and daily trading volumes to see how these changed over the three months from October 15th through January 15th in both 1997-98 and 1998-99. Also included in the graphs below, for comparison purposes, are the Foolish Four stocks that I graphed last week:
Click for two year share prices, and two year trading volume.
As you can see, it appears the non-Foolish Four (low yield) stocks have more dramatic price increases and much bigger jumps in trading volume in the late December-early January period than the Foolish Four stocks. While this data is just from the past two years -- although that is presumably the time period that would be most affected by the "popularity problem" -- the fact that these un-Foolish Four stocks jumped so much is interesting.
At the very least, it indicates that drawing conclusions based on trading patterns over a very short term (as McQueen and Thorley did) is rather dangerous, if not downright misleading. If McQueen and Thorley had looked at a longer time period, or even compared the behavior of the Foolish Four with other Dow stocks, it would have been obvious that they weren't seeing a huge surge in buying that could be attributed to the popularity of the Foolish Four or the Dogs of the Dow or any high-yield Dow strategy.
This is not to deny that Dow investing has some impact. Another interesting set of numbers to look at are the closing prices of high-yield stocks on the last trading day of the year compared to the opening prices on the first trading day of the following year. You might think that these would be the same numbers, but a stock can cost more in the morning than it did he night before (or less) as a result of changes in demand for the stock. As a result, if demand is much higher for a particular set of stocks at the opening of trading than it was the night before, its price will "gap up" in response.
This does seem to occur with the Foolish Four stocks. In the table below, I compare five high-yielding stocks in the past two years with five low-yielders:
High-Yield Stocks  Dec. 31 close  Next-day open  Change
1997-98  EK          60.5625         62.125       2.58%
         MO          45.25           45.375       0.28%
         DD          60.0625         61.5         2.39%
         UK          42.9375         43.5         1.31%
         IP          43              45           4.65%

1998-99  IP          44.8125         44.375      -0.98%
         MMM         71.125          72.375       1.76%
         CAT         46              48           4.35%
         JPM        105.0625        107           1.84%
         CHV         82.9375         83.0625      0.15%
                                            Avg:  1.83%

Low-Yield Stocks   Dec. 31 close  Next-day open  Change
1997-98  WMT         39.4375         39.4375      0.00%
         MCD         47.75           47.875       0.26%
         DIS         99              99.8125      0.82%
         HWP         62.375          62.5625      0.30%
         IBM        104.625         104.5        -0.12%

1998-99  WMT         81.4375         81.625       0.23%
         MCD         76.8125         77.375       0.73%
         DIS         30              30.1875      0.63%
         HWP         68.3125         68.375       0.09%
         IBM        184.375         185           0.34%
                                            Avg:  0.33%
The table above seems to be fairly clear: high-yielding Dow stocks, at least in the past couple of years, do seem to open higher than low-yielders on the first trading day of the year. This could certainly be the result of a flood of orders from the Unit Investment Trusts. So perhaps the first trading day of the year isn't the best time to buy Foolish Four stocks.
Nevertheless, when we look at a longer time frame, as we did last week, it's clear that this is a small, temporary effect. Especially when we compare the high-yielding Dow stocks to the low-yielding ones, it's obvious that whatever effects Dow investing has on the market are pretty limited in scope. Dow investing is just one of a million things impacting the markets every day.
That ought to settle the issue for a while. Nevertheless, it's important for us to keep our eyes open. If any of you ever run across any evidence you believe indicates trouble for the Foolish Four, let us know, and we'll check it out. Fool on!
Today's Stock Lists | 1999 Dow Returns
05/27/99
Close
Stock Change Last -------------------- CAT -2 7/16 55.38 JPM -3 3/4 135.13 MMM -2 13/16 86.00 IP -1 1/2 52.69 |
                Day   Month    Year   History
        FOOL-4   -3.21%  -5.13%  22.33%  24.15%
        DJIA     -2.20%  -2.99%  14.39%  13.93%
        S&P 500  -1.79%  -4.03%   4.56%   4.82%
        NASDAQ   -0.33%  -4.86%  10.33%  11.84%

    Rec'd   #  Security     In At       Now    Change

 12/24/98   24 Caterpillar   43.08     55.38    28.54%
 12/24/98    9 JP Morgan    105.51    135.13    28.07%
 12/24/98   22 Int'l Paper   43.55     52.69    20.98%
 12/24/98   14 3M            73.57     86.00    16.90%


    Rec'd   #  Security     In At     Value    Change

 12/24/98   24 Caterpillar 1034.00   1329.00   $295.00
 12/24/98    9 JP Morgan    949.62   1216.13   $266.51
 12/24/98   22 Int'l Paper  958.12   1159.13   $201.01
 12/24/98   14 3M          1030.00   1204.00   $174.00

              Dividends Received      $29.45
                             Cash     $28.26
                            TOTAL   $4965.96
|